
EM 1110-2-1100 (Part II)
30 Apr 02
Qr T
)
Qr '
(II-6-19)
2 π ao Ab
with Qr being the river or freshwater inflow to the bay, and a0, Ab, and T as defined previously. Fig-
ures II-6-25 and II-6-26 give high (or maximum) and low (minimum) dimensionless ratio water levels for
values of QrN and K (Equation II-6-4). Using Figures II-6-27 and II-6-28, maximum average ebb and flood
currents can be found and Figure II-6-29 is used to determine ocean high water to bay high water phase lag.
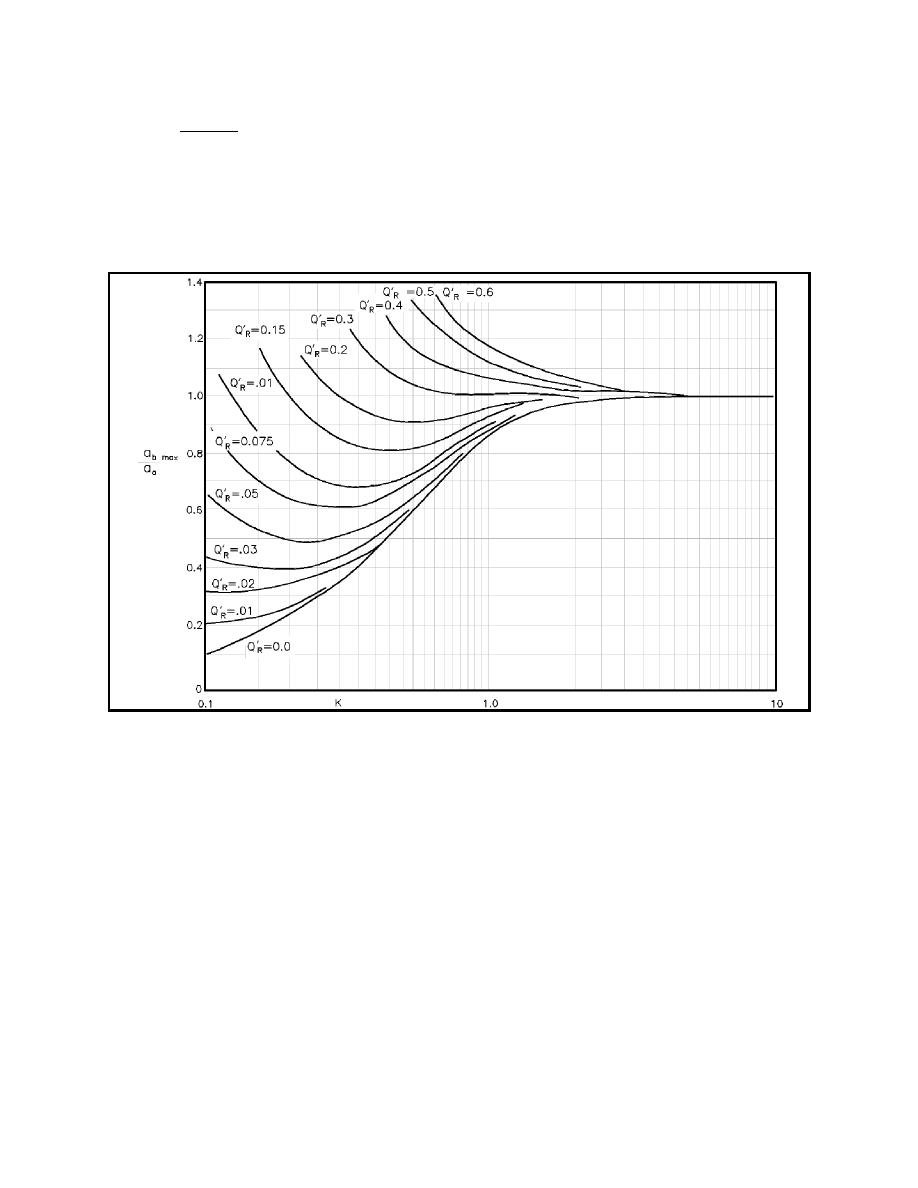
ab max/ao versus K for values of QrN (river discharge model)
Figure II-6-25.
(2) The above analysis assumes that waters in the inlet are well-mixed at the inlet minimum cross-
section, where the salinity variation over a vertical section varies only a small fraction from the local mean
salinity. As freshwater influence increases, it approaches a completely stratified flow, i.e., a flow that has
a well-defined interface between fresh and saline waters, and in which flow may be simultaneously
bidirectional (Wicker 1965). More sophisticated techniques should be used for such cases.
g. Bay superelevation.
(1) A superelevation of the bay means that the average level of the bay is greater than the average
elevation of the ocean over a given time period. An obvious cause of this effect is the introduction of fresh
water into the bay from local rivers and streams. The effect of long-term (months or years) rise in sea level
causing a long-term rise in bay level is not included in this definition of bay superelevation, since both sea
and bay are responding simultaneously. The bay may not rise at the same rate as the sea due to possible
circulation effects if multiple inlets connect the bay to the ocean.
Hydrodynamics of Tidal Inlets
II-6-29

 Previous Page
