
EM 1110-2-1100 (Part II)
30 Apr 02
Example Problem II-8-1 (Continued)
Option 1: (use ACES; this option is generally preferred)
A series of annual maximum wind speeds is taken from the table of data. The data include 13 complete years
(1970-1982) and two partial years (1969 and 1983). Combining January and February from 1982 with the March
-December 1969 data gives another full year for analysis. The annual maximum series with 14 values is then:
20, 22, 24, 23, 22, 24, 25, 22, 23, 21, 22, 23, 20, 21
m/s
These values are entered as significant heights into the ACES extremal significant wave height analysis
application. Appropriately, ACES provides a warning that a 14-year sample is too short to give a reliable estimate
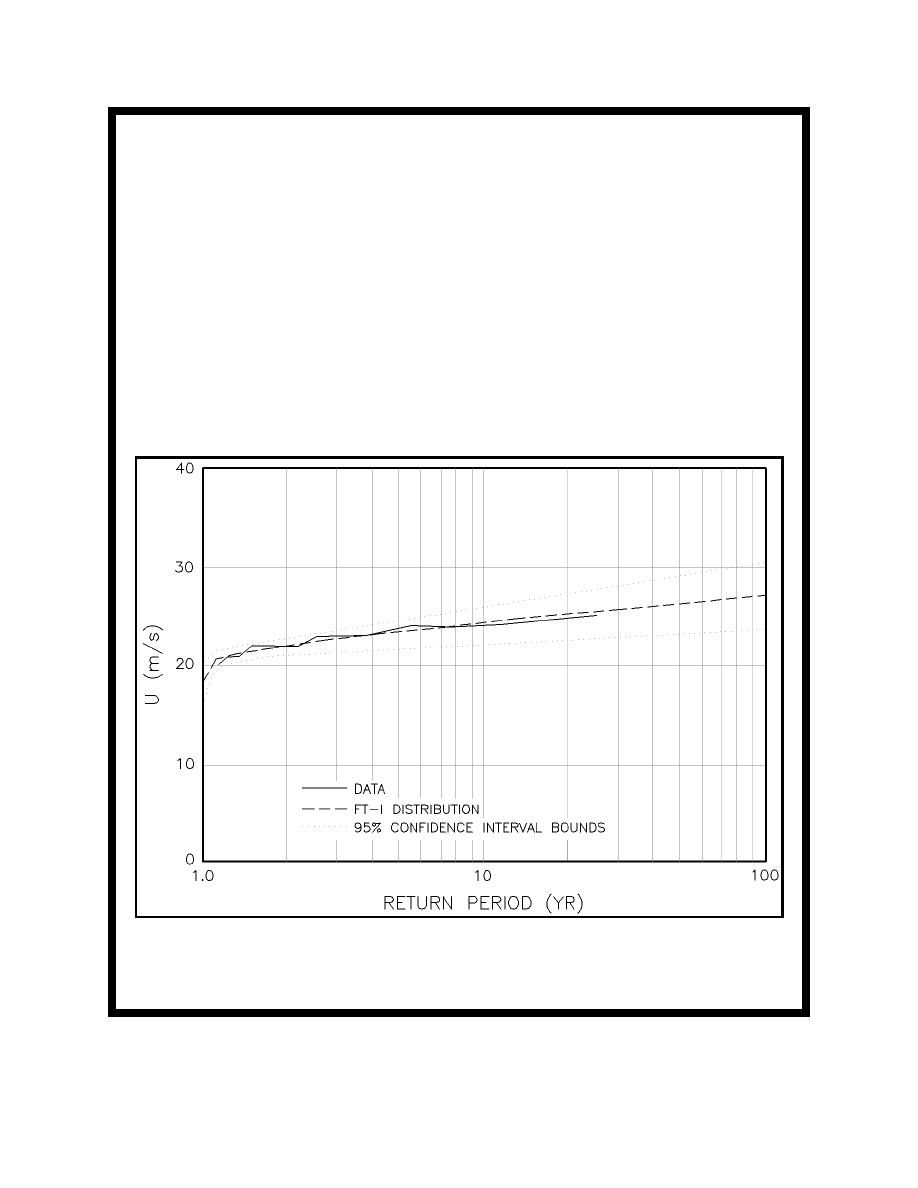
of the 50-year event. The FT-I distribution function is found to provide a good fit (Figure II-8-10). The
corresponding 25- and 50-year wind speeds are
U25 = 25.5 m/s
(10-min average)
U50 = 26.3 m/s
(10-min average)
Figure II-8-10.
Example Problem II-8-1 probability distribution of wind speeds
(Sheet 2 of 4)
II-8-22
Hydrodynamic Analysis and Design Conditions

 Previous Page
