
EM 1110-2-1100 (Part II)
30 Apr 02
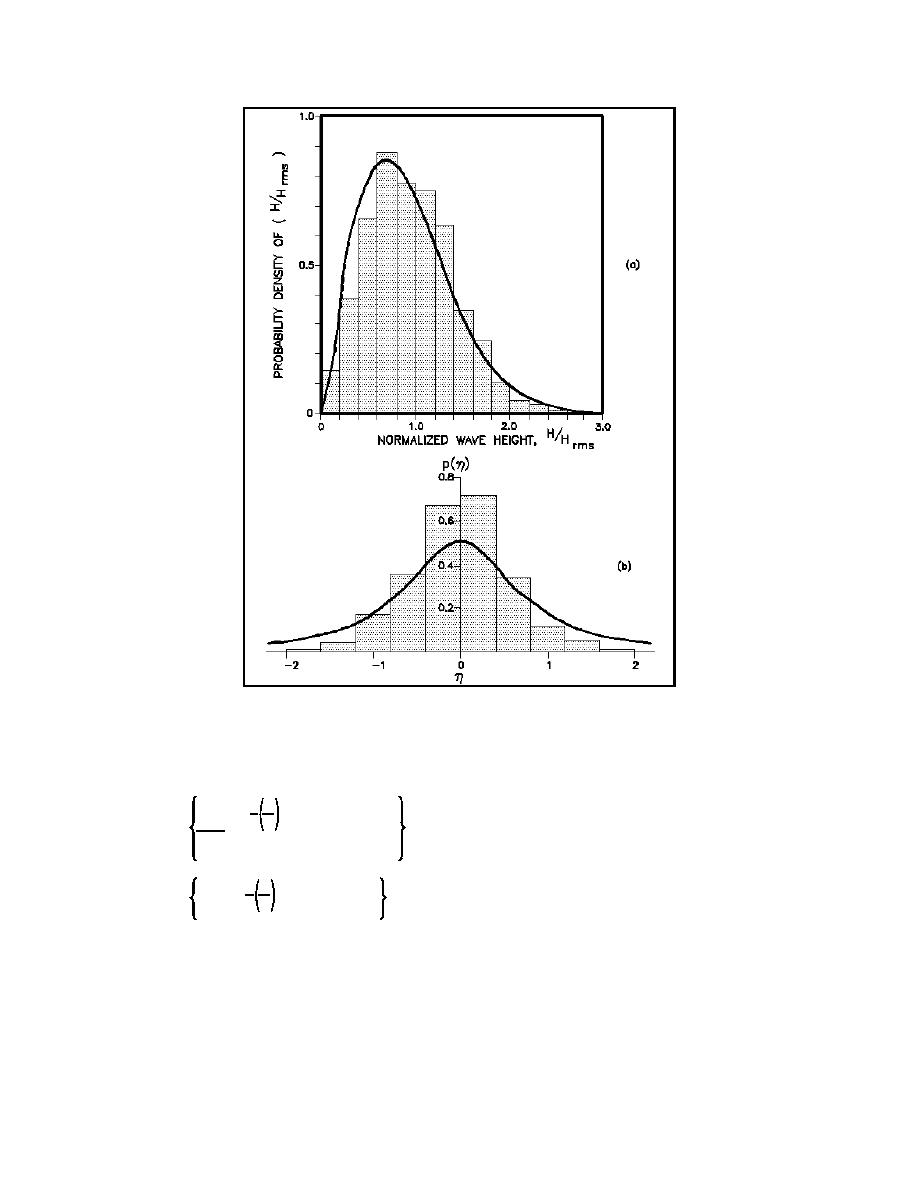
Figure II-1-30. Histograms of the normalized (a) wave heights, and
(b) wave periods with theoretical distributions (Chakrabarti 1987)
2
π x
&
πx
4 x
for x$ 0
p (x) '
e
2
2 x
(II-1-129)
2
π x
&
4 x
for x $ 0
P(x) ' 1 & e
where x is the mean. These are displayed in Figure II-1-29 in which the density function is offset to the right
and has only positive values. The distributions used for wave heights, wave periods, and their joint relations
are described next.
Water Wave Mechanics
II-1-73

 Previous Page
