
EM 1110-2-1100 (Part II)
30 Apr 02
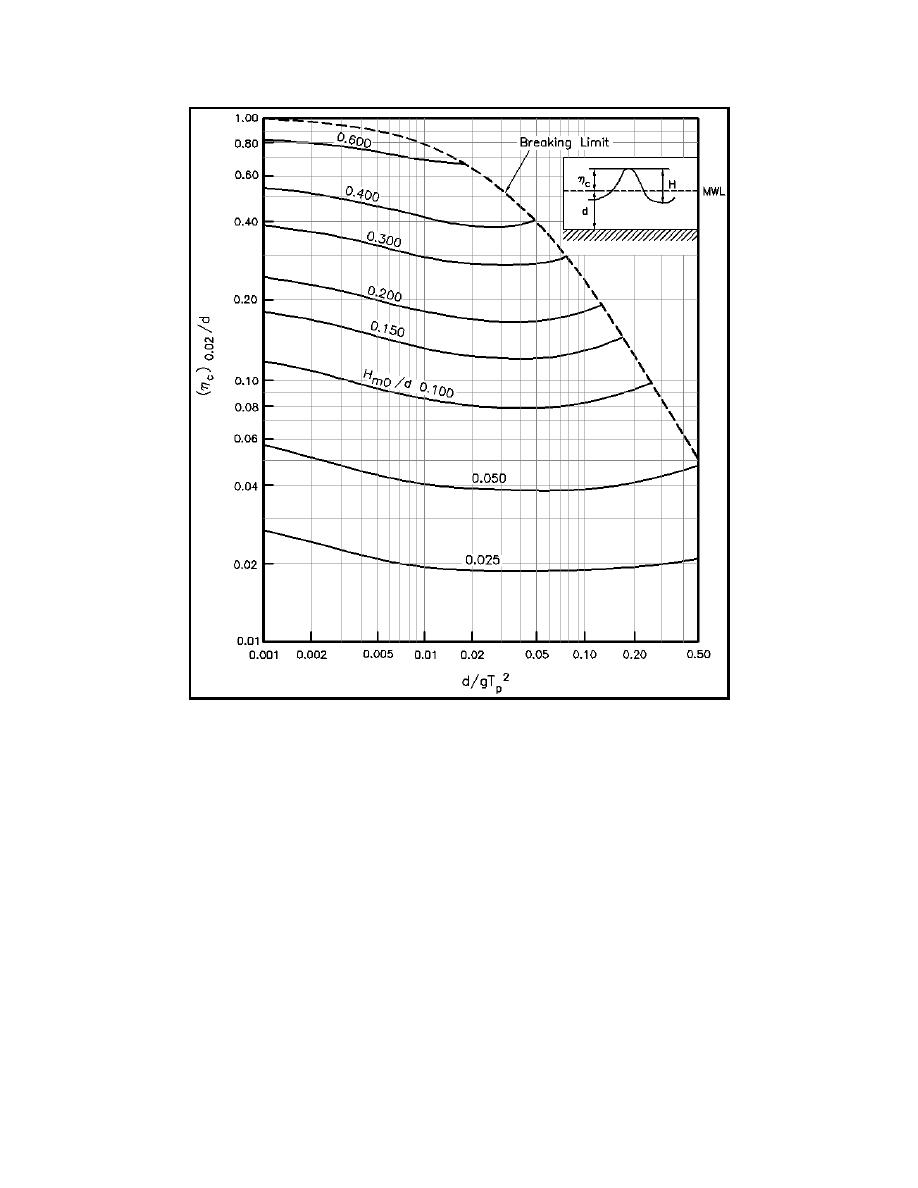
Figure II-8-14. Crest elevation at the 2-percent probability level of exceedance
(Seelig, Ahrens, and Grosskopf 1983)
than one major wave system about two-thirds of the time (Thompson 1980). Wave climate can vary greatly
between seasons of the year, but variations between years are usually small. At least three full years of data
are desirable for a stable estimate of wave climate. Figure II-8-15 is a typical table of wave climate
information (from one directional sector) from the Wave Information Studies.
(b) The mean Hs and distribution of Hs are always of interest in describing wave climate. Both Weibull
and log-normal distribution functions have been used to represent the distribution of Hs. However, the actual
data usually provide a sufficiently stable estimate and the formal distribution functions are unnecessary.
Means and distributions of Tp and θp are vital for some applications. Joint occurrence probabilities of Hs, Tp,
and θp give a fairly complete representation of wave climate, which is needed in applications such as
nonlinear refraction modeling. When these standard statistical summaries are formed, information about the
simultaneous occurrence of more than one wave system is lost.
Hydrodynamic Analysis and Design Conditions
II-8-29

 Previous Page
