
EM 1110-2-1100 (Part II)
30 Apr 02
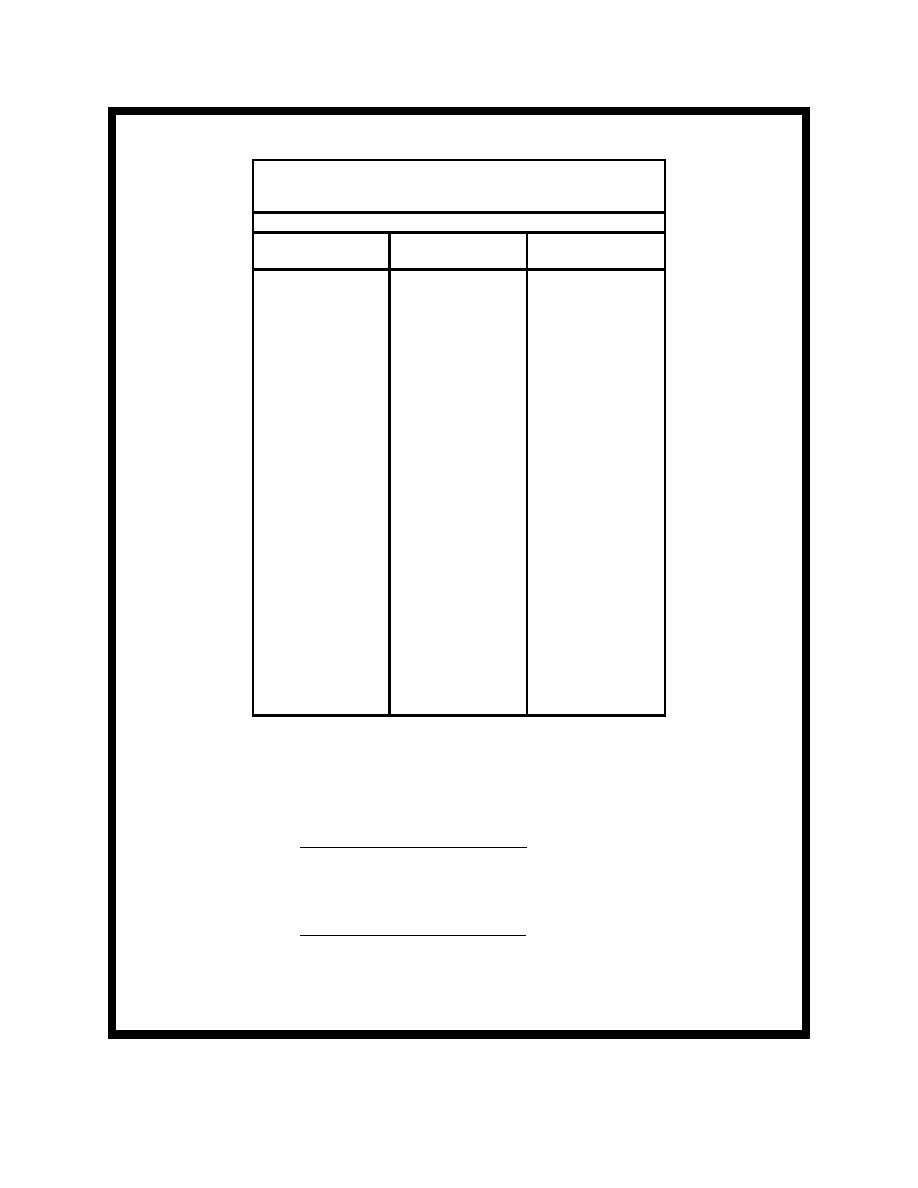
Example Problem II-8-2 (Continued)
Lower Limit of Class Interval Shown, All Heights are Normalized by
Half the Diurnal Range 1.274 m
[Extracted from Table B-37b (Harris 1981)]
High Water
Lower Limit
Cumulative
1.4547
.0001
.0001
.
.
.
.
.
.
1.1018
.0110
.0989
1.0877
.0105
.1094
.
.
.
.
.
.
0.9183
0.0206
0.2891
0.9043
0.0229
0.3120
.
.
.
.
.
.
0.7771
0.0213
0.4919
0.7630
0.0187
0.5106
.
.
.
.
.
.
0.6218
0.0185
0.6923
0.6077
0.0156
0.7079
.
.
.
.
.
.
0.4101
0.0077
0.8896
0.3960
0.0108
0.9004
Figure II-8-23. Astronomical tide probability referenced to MSL
A value of N = 5, corresponding to probability increments of 0.2, was used for this problem. The mid-
probabilities are 0.1, 0.3, 0.5, 0.7, and 0.9. High tide levels matching these probabilities, determined from Figure
II-8-24, are in Table II-8-14. The probability of the most severe surge/wave event is the reciprocal of the number
of possible measurements (at 6-hr intervals or 4 observations per day) during 17 years:
1
' 0.000040
( 4/day ) ( 365 days/yr ) ( 17 yr )
Similarly, the probability corresponding to the design life of 25 years is:
1
' 0.000027
( 4/day ) ( 365 days/yr ) ( 25 yr )
Example Problem II-8-2 (Sheet 8 of 21)
II-8-42
Hydrodynamic Analysis and Design Conditions

 Previous Page
