
EM 1110-2-1100 (Part II)
30 Apr 02
Example Problem II-8-2 (Continued)
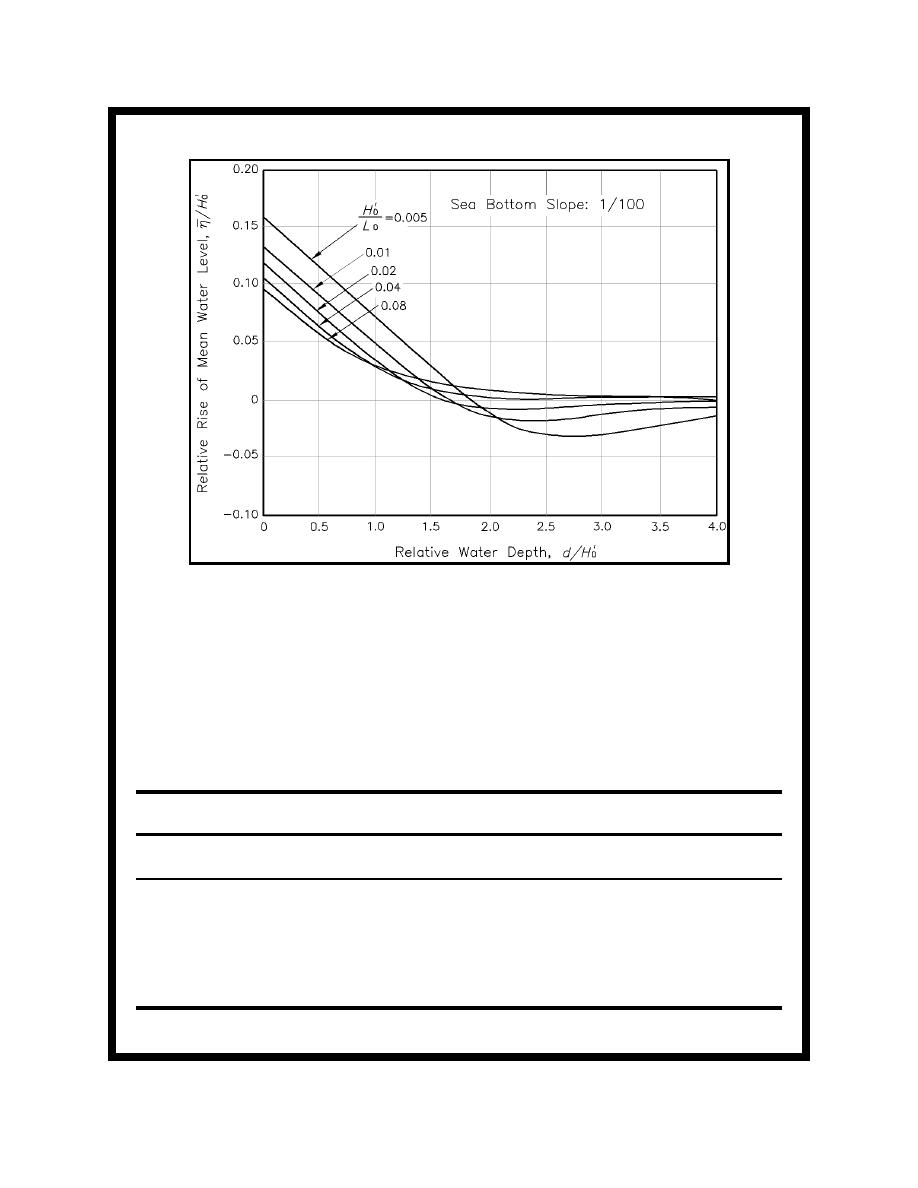
Figure II-8-24.
Estimation of wave setup (Goda 1985)
A 1-in-17-year event coupled with a 0.1 probability high tide level corresponds to a combined probability of
0.000040 0.1=0.000004. Since this probability is well below the 25-year design probability, the number of tide
increments is sufficient for illustration.
The jetty is divided into three design segments with bottom levels of -10 m MLLW (representing the jetty head),
-6 m MLLW and -2 m MLLW (representing sections along the jetty trunk). Tidal water levels at the five
probability levels (expressed as exceedance frequencies in percent) are summarized in Table II-8-14. Information
in Table II-8-12 is used to convert from MSL to MLLW datum.
Table II-8-14
Tidal Water Levels for Jetty Design
Exceedance Frequency (percent)
Water Level
90
70
50
30
10
High tide level, in m MSL
+0.51
+0.78
+0.98
+1.16
+1.40
High tide level, in m MLLW
+1.87
+2.14
+2.34
+2.52
+2.76
Tidal water depth (m)
Bottom at -10 m MLLW (jetty head)
11.9
12.1
12.3
12.5
12.8
Bottom at -6 m MLLW (jetty trunk)
7.9
8.1
8.3
8.5
8.8
Bottom at -2 m MLLW (jetty trunk)
3.9
4.1
4.3
4.5
4.8
Example Problem II-8-2 (Sheet 9 of 21)
Hydrodynamic Analysis and Design Conditions
II-8-43

 Previous Page
