
EM 1110-2-1100 (Part II)
30 Apr 02
Example Problem II-8-2 (Concluded)
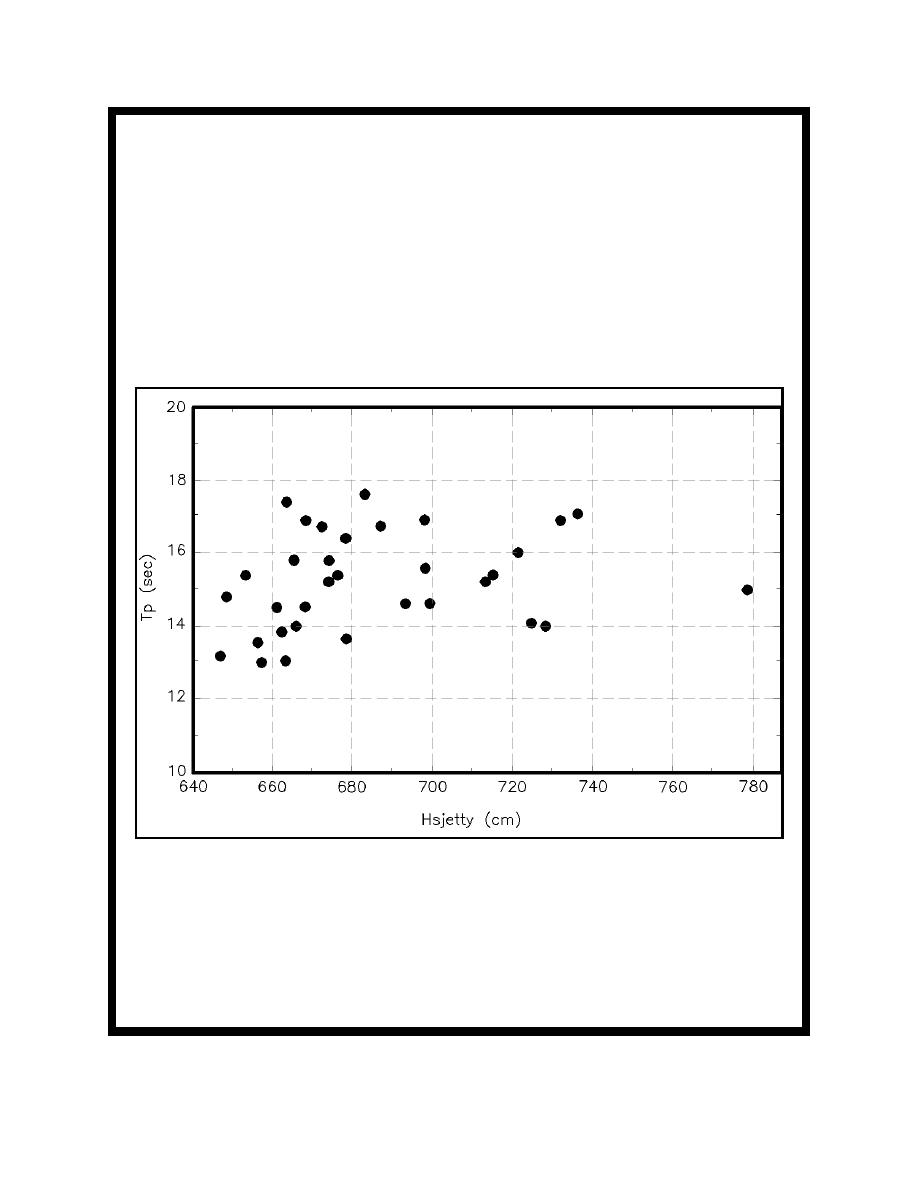
Design wave period. Design wave periods can be estimated from measured values of Tp (Table II-8-13). A scatter
plot of Tp versus Hsjetty gives perspective on how wave periods are related to extreme wave heights (Figure II-8-32).
Values of Hsjetty in the figure are for only the highest of the five tide levels used in conjunction with the 33 storm
events. The figure indicates that the design wave period range of 14-18 sec is representative of the higher wave
conditions of interest in design.
Confidence intervals. Confidence intervals or uncertainties in hydrodynamic design estimates should always be
considered. Confidence intervals associated with statistical aspects of extremal analysis are included in this
example. However, there are other sources of uncertainty. For example, the quality of available information is
an important concern. Wave information may be from accurate, well-maintained gauges, lower quality
measurements, hindcasts (which can vary in quality), or observations. Such concerns are not addressed in this
example, but they are given some attention in Parts V and VI.
Figure II-8-32.
Joint distribution of Hsjetty and Tp from 33 storm events, jetty head
Final design conditions. In final design of a jetty or any comparable major coastal engineering project, the
complexity of variable bathymetry, breaking waves, currents, interaction between waves, currents, and structures,
etc., cannot be adequately represented with the procedures used in this example. Even comprehensive numerical
models are limited in their capabilities for reproducing the full design conditions. Standard practice is to construct
a three-dimensional physical model and use it to determine the final project design.
Example Problem II-8-2 (Sheet 21 of 21)
Hydrodynamic Analysis and Design Conditions
II-8-55

 Previous Page
