
EM 1110-2-1100 (Part II)
30 Apr 02
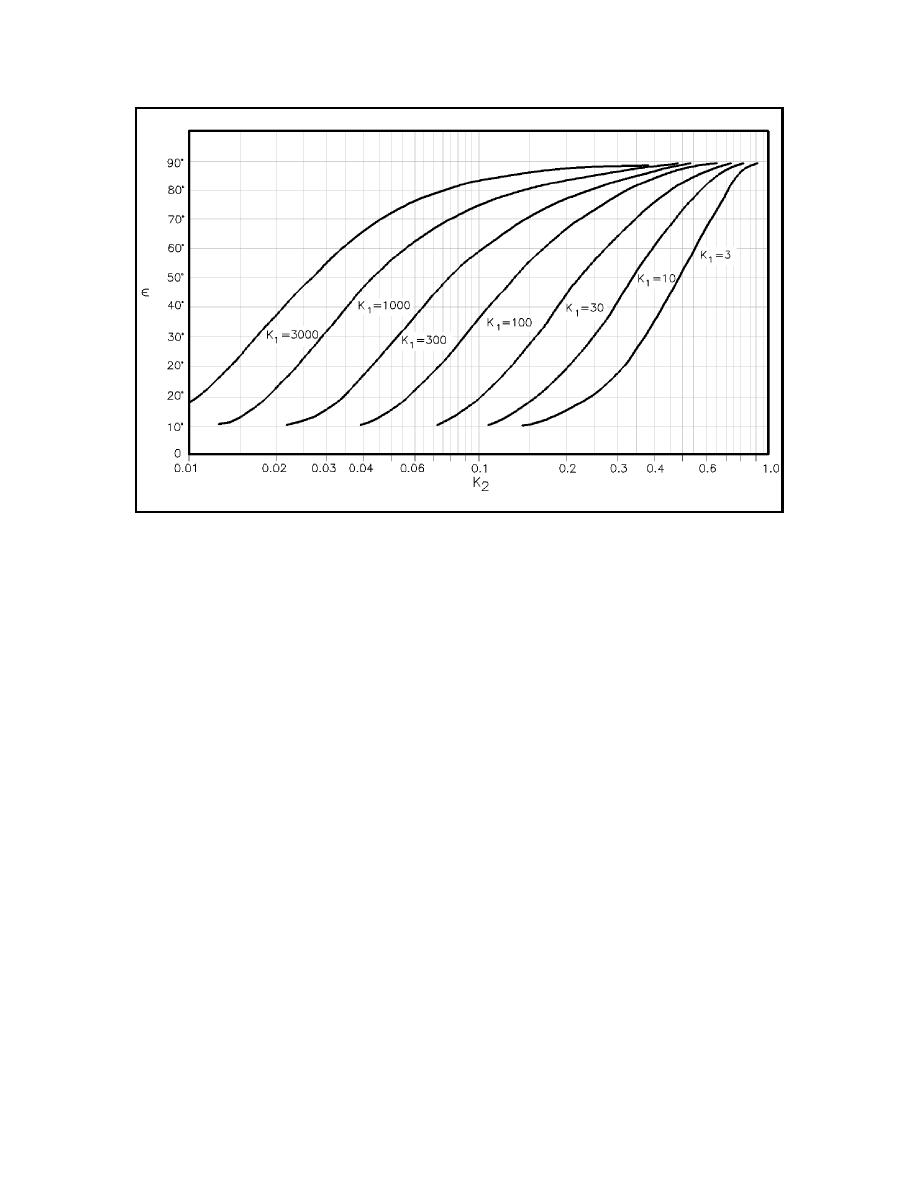
Figure II-6-20.
Bay tidal phase lag versus K1 and K2
From a detailed bathymetric chart of the inlet, sketch lines that best approximate flood flow lines
through the inlet as shown in Figure II-6-21. Establish 10 equally spaced cross-section ranges
perpendicular to these flow lines, extending from MSL (mean sea level) on one side of the channel
to MSL on the other (i.e. from one side of the inlet to the other). Measure cross-sectional area below
MSL of each range and determine average area. Depths on most navigation charts are referenced
to mean low or mean lower low water, and a correction factor should be added to these depths to
determine the area below MSL.
(2) Bay area. Typically the problem is to define the extent of the inlet's influence throughout the bay.
To do this, the following are recommended:
(a) Examine any existing tide records from stations located throughout the bay to define limit of the
inlet's influence.
(b) Examine bathymetry of the bay to determine presence of natural sills, narrows, or shoal areas which
can preclude significant tidal exchange.
(c) Locate any areas of heavy shoaling at points distant from the inlet, particularly in waterways connect-
ing the bay of interest with more remote bodies of water, and define these sites as the effective bay limits.
(d) The surface area of the bay is usually varying to some degree, but for an initial iteration, the mean
water line could be chosen (as well as it can be delineated).
(3) Friction factor.
(a) "f" is a dimensionless parameter that is a function of hydraulic radius R and Manning's roughness
coefficient n:
Hydrodynamics of Tidal Inlets
II-6-21

 Previous Page
