
EM 1110-2-1100 (Part III)
30 Apr 02
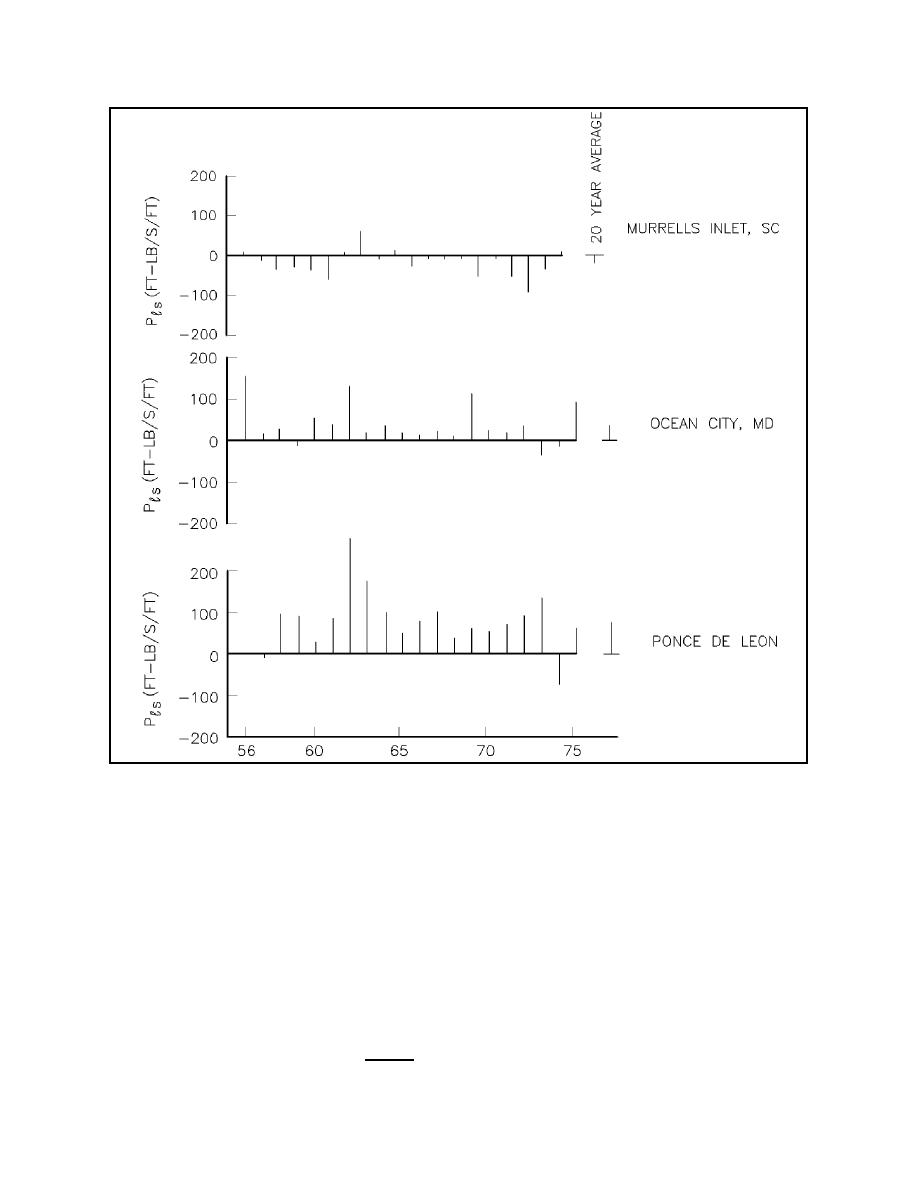
Figure III-2-8.
Time plot of annual longshore energy flux factor at three east coast sites (after Douglass
(1985))
Figure III-2-9 provides an example of the variability of the monthly (net) longshore energy flux factor for
the same three locations. Figures III-2-8 and III-2-9 show that as the averaging period gets shorter, the
variability of the sediment transport rate increases due to the fact that integration is a smoothing process and
reduces the variance in the data. For design purposes, an assessment of the uncertainty in the sediment
transport climate can be addressed via simulation of the sediment transport rates. Walton and Douglass
(1985) have provided an approach to such simulation for the case of monthly sand transport rates which, for
the locations assessed, appeared to be in reasonable conformance with a normal distribution assumption.
Figure III-2-10 from Walton and Douglass (1985) shows the distribution of monthly averages of longshore
energy flux factor for a coastal location in South Carolina. The data are reasonably represented by a normal
distribution, as shown by the fit of the solid line to the data. Figure III-2-11, also from Walton and Douglass
(1985), is for the same location but with weekly averages. In this case, the weekly averages vary considerably
from a normal probability distribution.
III-2-28
Longshore Sediment Transport

 Previous Page
