
EM 1110-2-1100 (Part III)
30 Apr 02
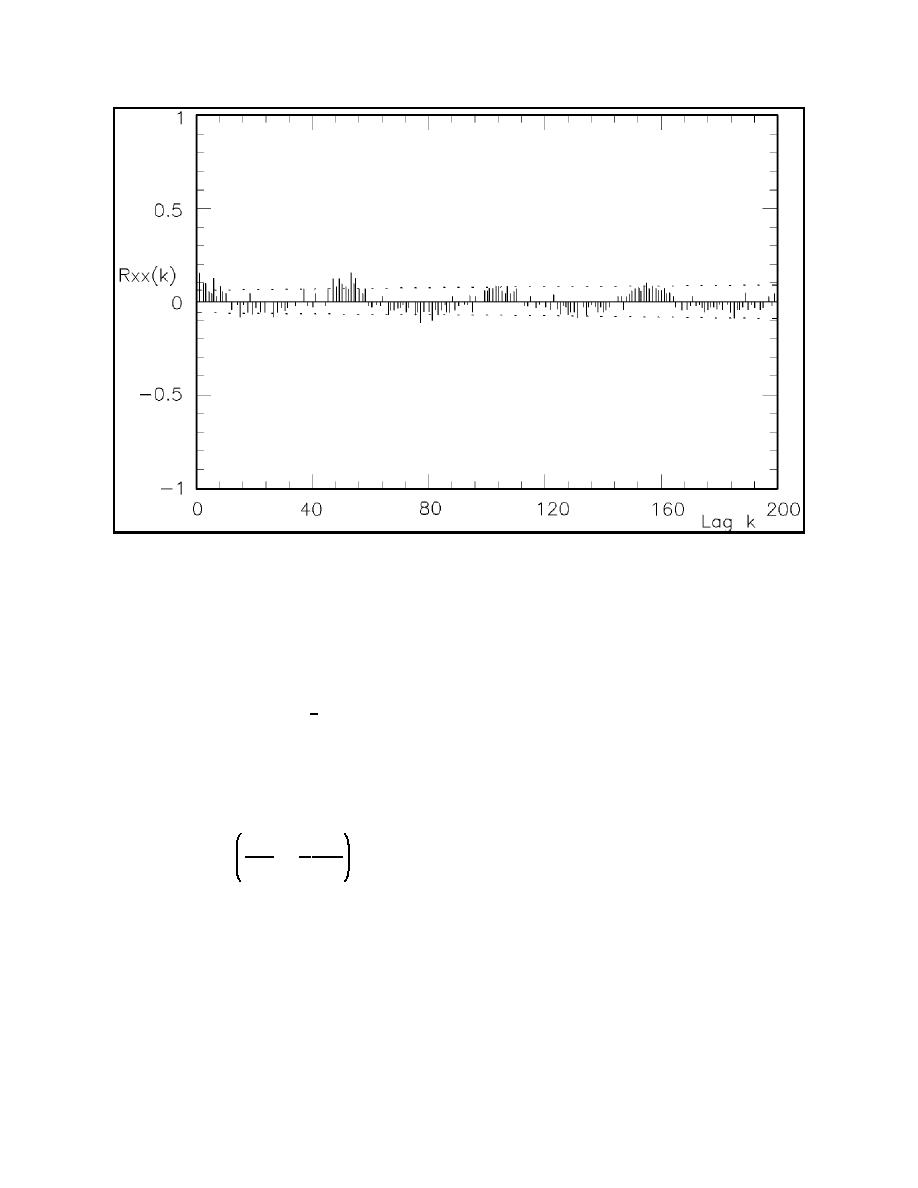
Figure III-2-13.
Autocorrelation of weekly average Pls series (Walton and Douglass 1985)
instrumentation accuracy and observer bias. Given that there are breaking wave height and wave angle
uncertainty values ∆Hb and ∆αb, respectively, an associated longshore transport uncertainty ∆QR can be
calculated. From Equation 2-7b, we see that QR ~ Hb5/2 sin 2αb. Uncertainty in the longshore transport rate
can be estimated by including the uncertainties in breaking wave height and angle:
5
(III-2-20)
2
QR ∆QR -(Hb ∆Hb) sin2(αb ∆αb)
Assuming that the wave angle at breaking is small, and using the first two terms of a Taylor series expansion
of Equation 2-20, the uncertainty in the longshore transport rate is estimated as
∆αb
5 ∆Hb
∆QR - QR
%
(III-2-21)
αb
2 Hb
Thus, a 15-percent uncertainty in wave height and 15 percent uncertainty in wave angle result in 37.5- and
15-percent uncertainty contributions for height and angle, respectively, totaling a 52.5-percent uncertainty
in QR.
(3) Sand supply availability. Application of the potential longshore sand transport equations presented
herein results in an estimate of transport that implies the availability of an unlimited supply of sand. If sand
availability is limited, such as on a rocky or reef coastline, or interrupted such as in the vicinity of groins,
jetties, or breakwaters, the actual longshore sand transport rate will be less than the calculated rate.
III-2-32
Longshore Sediment Transport

 Previous Page
