
EM 1110-2-1100 (Part III)
30 Apr 02
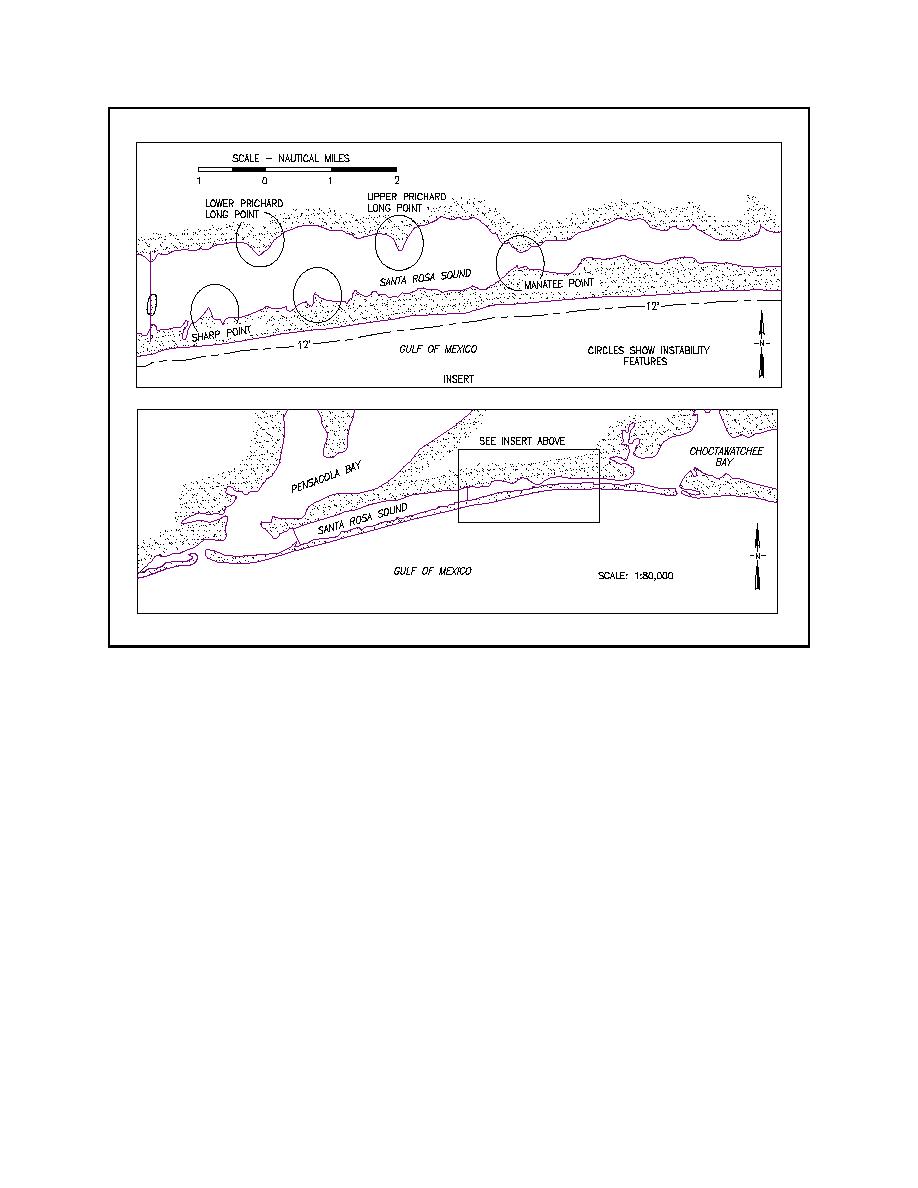
Figure III-2-17.
Instability-formed capes in Santa Rosa Sound (Walton 1972)
zone. Ingle (1966) used fluorescent-dyed sediment at five test sites along the California coast to investigate
the longshore rate of tracer dispersion, as well as its cross-shore distribution. An example of the cross-shore
distribution of tracer density measured at Goleta Point in October 1961 is shown at three measurement
intervals for two surf zone cross-sections in Figure III-2-19. Cross-section A represents conditions 46 m
(150 ft) downdrift of the release line, and cross-section B is 46 m (150 ft) downdrift of cross-section A. The
distributions indicate that the most rapid tracer dispersal took place at the edge of the swash zone, while the
greatest tracer transport took place at the breaker zone.
(3) Using sediment traps operated from a Florida pier across the outer portion of the surf zone, Thornton
(1972) found that longshore transport was a maximum on the seaward side of the longshore bar where waves
were breaking. Sawaragi and Deguchi (1978) placed round sediment traps divided into pie-shaped sections
into the beach and found three basic longshore transport distribution profiles: (1) maximum in the swash zone
or near the shoreline, (2) maximum at the breaker line, and (3) bimodal with maxima at the shore and breaker
lines. From a field study using fluorescent tracers, Kraus et al. (1982) likewise observed similar results in
addition to a generally uniform cross-shore distribution. Berek and Dean (1982) inferred longshore transport
distribution from measurements of contour rotation in a pocket beach at Santa Barbara, California, and found
from their data that the transport was greatest across the inner surf zone. Kraus and Dean (1987) and Kraus,
Gingerich, and Rosati (1989) give general examples of vertical and cross-shore distributions of longshore
sediment flux measured with portable traps (see Figure III-2-2).
Longshore Sediment Transport
III-2-37

 Previous Page
