
EM 1110-2-1100 (Part III)
30 Apr 02
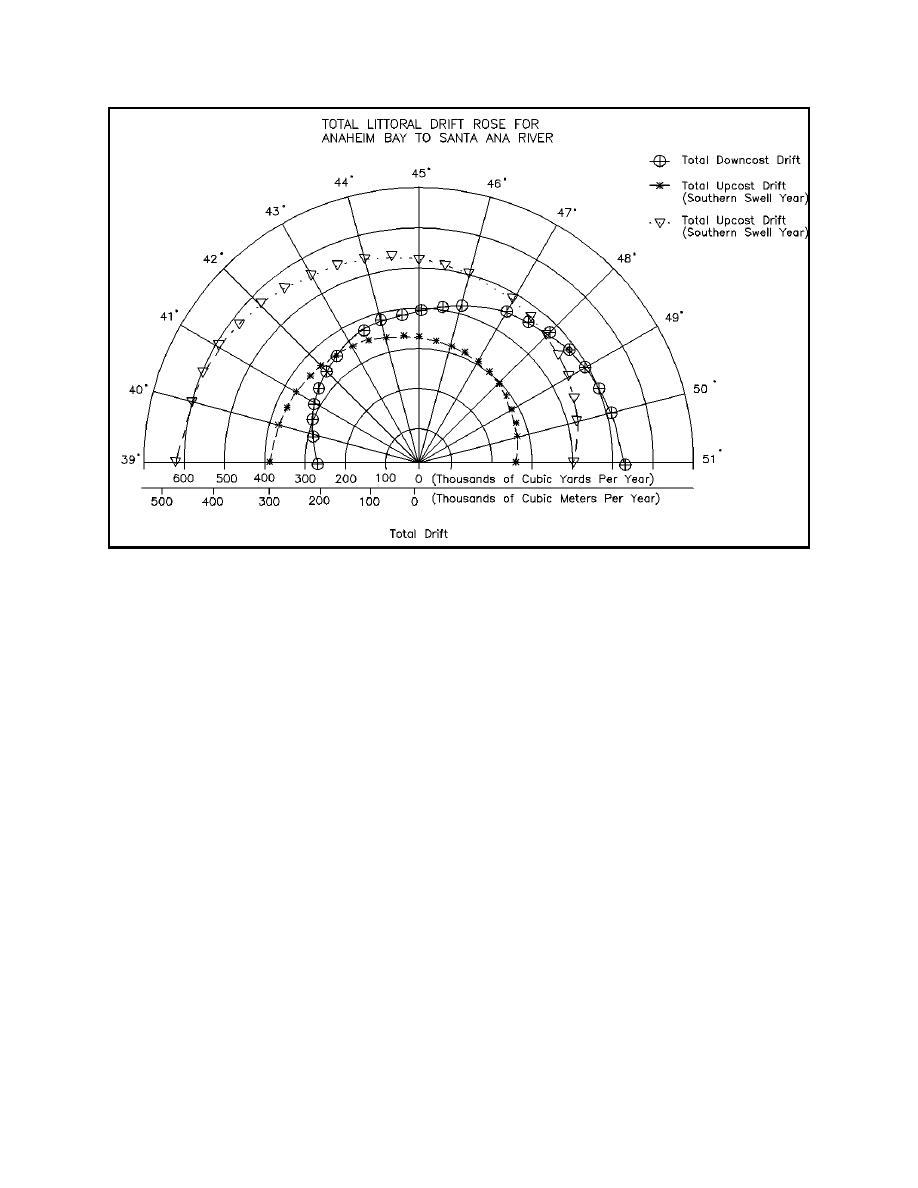
Figure III-2-49.
Total littoral drift rose, Anaheim to Santa Ana River (Gravens 1990a)
(h) Secondly, in the vicinity of the Huntington Pier (between alongshore coordinates 80 and 90), it is
noted that the predicted shoreline positions do not agree well with the survey. The lack of agreement is due
to limitations in the groin boundary condition used to simulate the effects of the pier. The imposed boundary
condition at the pier was investigated in detail, and the conclusion was that the boundary condition imposed
at the Huntington Pier had no significant effect on the model results northeast of the sea cliffs over the
modeling interval.
(i) Finally, in the vicinity of the proposed entrance system (between alongshore coordinates 155 and
220), the predicted and measured shoreline positions are in very good agreement. Model results for this
region are considered to have high reliability.
(j) The next step was to verify the model by performing a simulation using the same calibration
parameters for a different time period. The verification time period (1970 to 1983) included two beach fill
projects at the Surfside-Sunset feeder beach, the first in 1971 (2.3 million cu yd) and the second in 1979 (1.66
million cu yd). The results of the model verification are shown in Figure III-2-51. Although the agreement
between the calculated and measured shoreline positions is not as close for the verification as it was for
calibration, overall measured change in shoreline position was reproduced and was considered acceptable.
The largest discrepancies between measured and predicted shorelines occur adjacent to the Anaheim Bay
jetty, where initial losses of fine-grained beach fill to the offshore may have contributed to the differences.
Longshore Sediment Transport
III-2-85

 Previous Page
